RedcrabX
Mathematics, made visual.
A free-form worksheet for engineers, scientists and students. Mix live formulas, plots, charts, images and rich-text notes on a single canvas — calculate, annotate and print, all in one place.
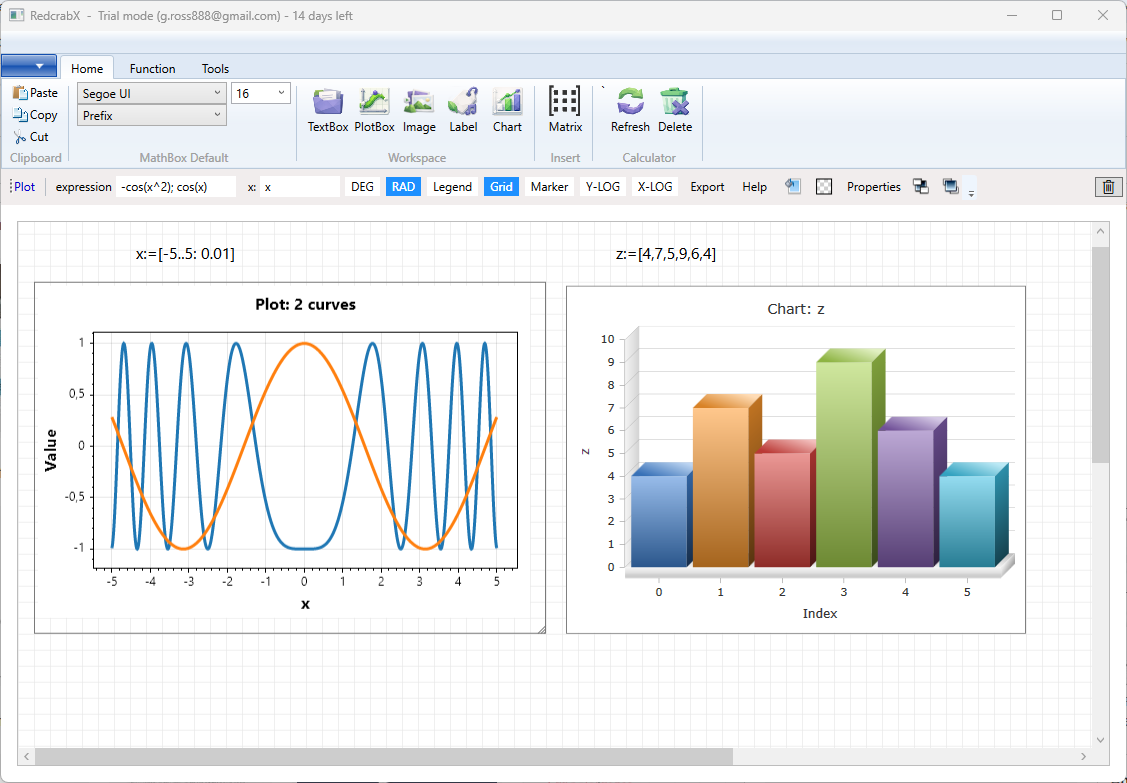
One canvas. Every tool you need.
RedcrabX combines a powerful mathematical expression engine with a free-form layout. Drop boxes anywhere on the worksheet, link them through variables and watch results update live.
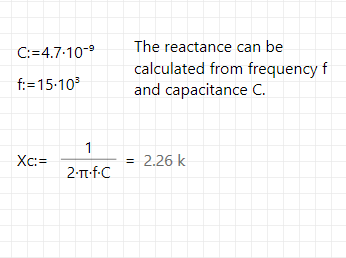
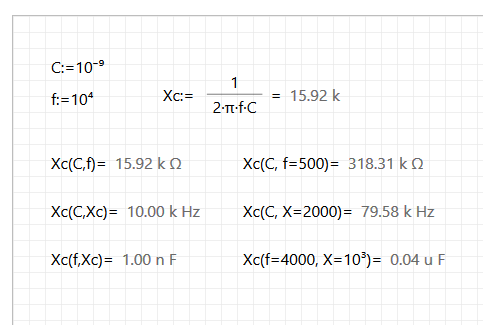
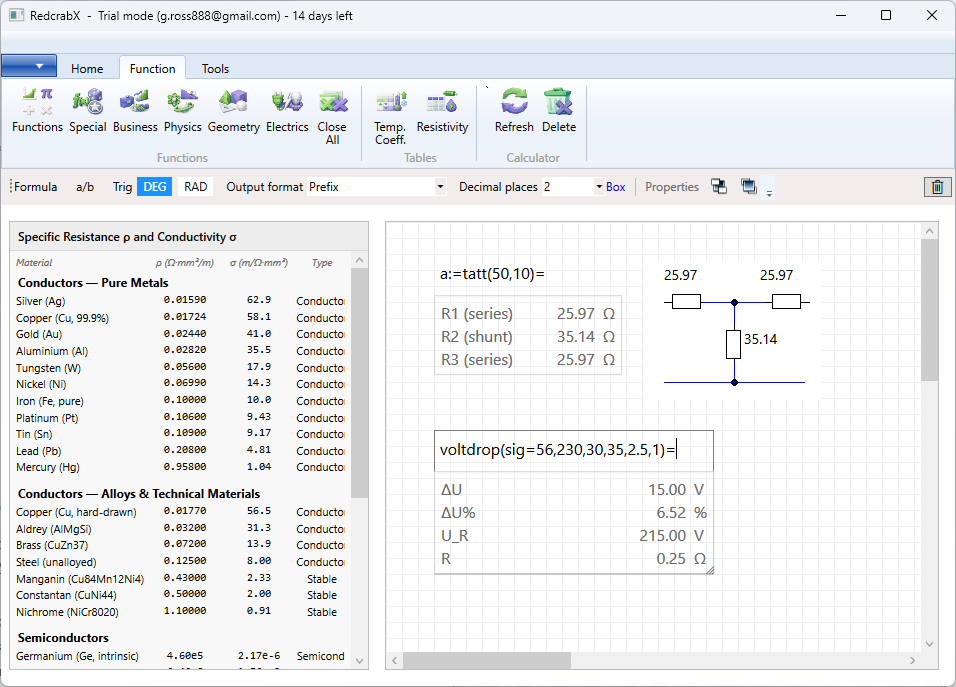
Live formulas
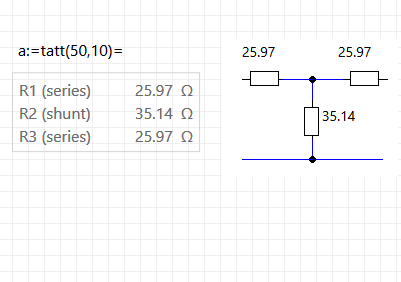
Type expressions naturally — U = R*I, sin(x),
integral(...). Results update as you edit, with degree/radian
and configurable output formats.
Plots and charts
Plot any expression in one or more variables. Multi-series charts, log scales, custom axes, legends, line styles and colors — all configurable from a toolbar.
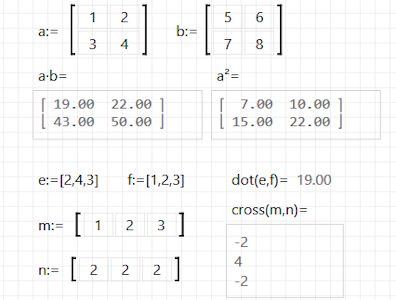
Matrices & vectors
First-class matrix and vector syntax with det, inv,
solve, eigenvalues, dot, cross, rotation and quaternions —
backed by MathNet.Numerics.
Rich-text notes
Document your reasoning right next to the math. Fonts, sizes, colors, bold, italic, underline and alignment — saved with the worksheet.
Labels & anchors
Pin compact labels to any box. Show live values, axis titles or callouts that follow their target whenever you rearrange the worksheet.
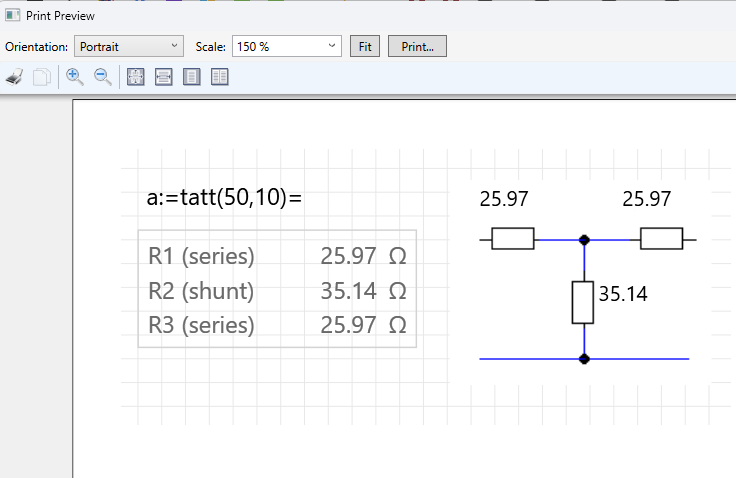
Print & share
Print the entire worksheet or just a selected region. Save as a compact JSON
.rcx file that is fully self-contained — even images.
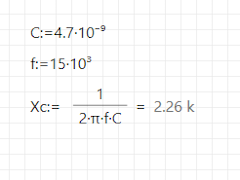
Calculate the way you think.
MathBoxes accept a natural mathematical syntax with Greek letters, fractions, square roots, exponents and ranges. Define a variable once and use it anywhere on the worksheet — results recompute automatically.
- Scalars, complex numbers, vectors, matrices and arrays
- Range literals like
[1..6]or[1..12:0.1] - Constants
pi,e,phiand physical units - Output formats: floating point, scientific, technical, prefix, hex, octal, binary
- Configurable decimal places and trigonometric mode
Configure default font, size and output format for new MathBoxes from the ribbon — existing boxes keep their own settings.
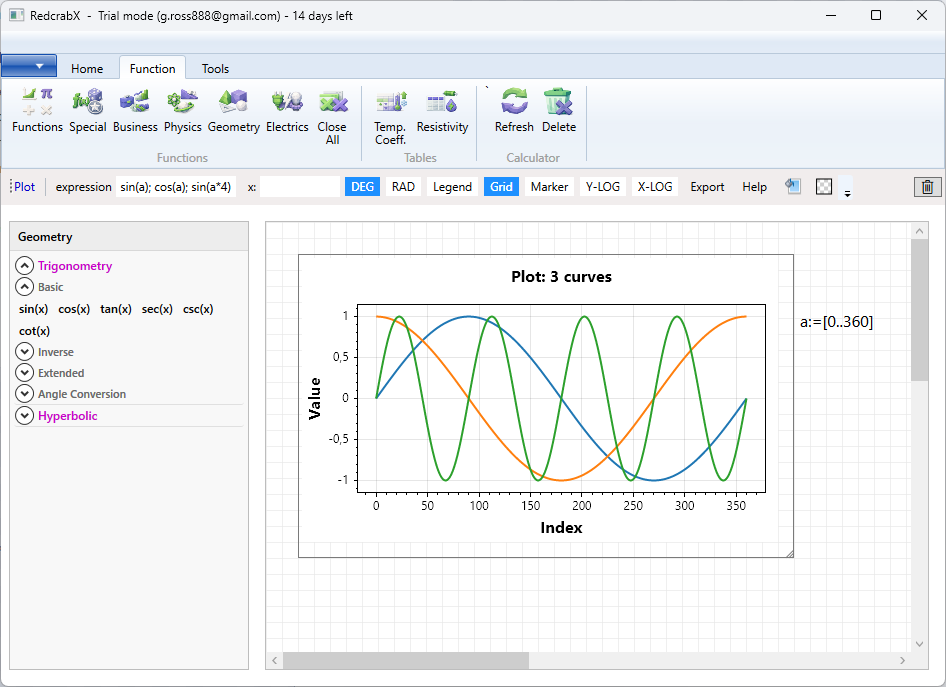
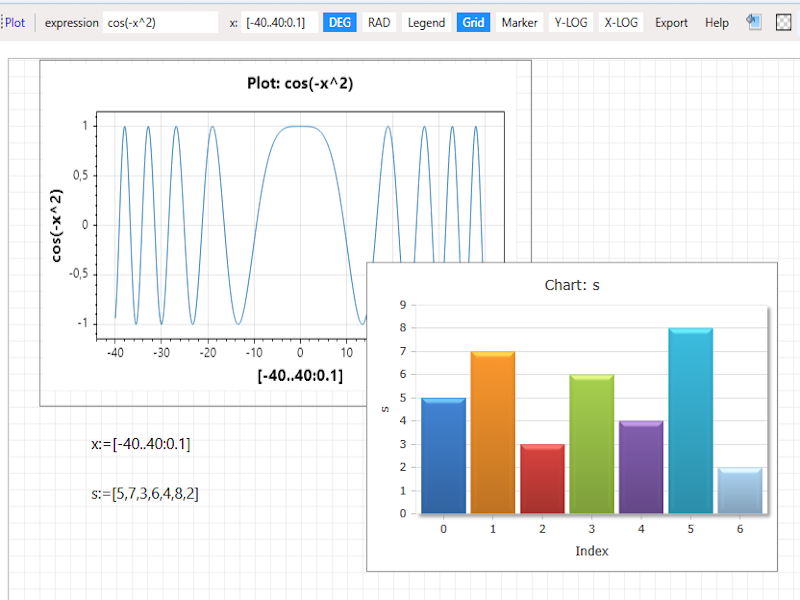
Visualize results instantly.
PlotBoxes accept any mathematical expression in one variable and show the curve live as you edit. Add multiple expressions, customize line widths, styles and colors, set axis ranges or switch to logarithmic scales.
- One- and two-dimensional plots, line and marker styles
- Linear and logarithmic axes, grid and legend
- ChartBoxes for series-based charts (bar, line, scatter, 3D)
- Anchor labels to plots so axis titles and callouts move with the plot
A worksheet, not a wall of text.
The worksheet is a free-form canvas. Drop a MathBox here, an image there, a chart below and a TextBox with explanatory notes alongside. Everything stays where you put it — until you decide to move it.
- Drag and drop, resize, group, anchor
- Cut / Copy / Paste with the system clipboard (including images)
- Print the whole worksheet or just a selected rectangle
- Save as a small
.rcxJSON file — version-control friendly
At a glance.
Built on .NET 10 / WPF for Windows. Self-contained .rcx documents.
No cloud, no account — your worksheets stay on your machine.
Ready to try RedcrabX?
Free download for Windows. No registration required.